Invasive Species » Unit 1: From Evolution in Isolation to Globalization » Activity 3: Timeline
Materials & Setup
- Materials for the timeline’s physical base (string, flagging tape, or butcher paper)
- Space large enough to accommodate it
- Teacher Background “Rate of Introduction Script” (pp. 4-10), “Timeline Cards” (pp. 11, 19-60), “Tables” (pp. 14-17)
Note: You may wish to laminate timeline and cards for durability.
For Each Student:
- Student Pages “Rate of Introduction” worksheet (pp. 61-62)
Instructions
1) Break students into small groups. Tell them that they will be creating a timeline to visually represent how often plant and animal species colonized the Hawaiian Islands in the past, and how that rate has changed.
If you have only one class period, reproduce the Teacher Background “Timeline Cards” (pp.19-60). Pass one or more cards out to each student and skip to instruction 4.
2) Assign each group several items from the list included in Teacher Background “Timeline Cards” on page 11. This list includes notable dates in Hawaiian natural history from 30 MA to present. (Find more comprehensive lists on pages 14-17: Teacher Background “Tables 1, 2, and 3.”)
3) For each list item, have students create a card with an image and a few facts, including the date of its initial arrival or occurrence in Hawaiʻi. Allow them time to research using the library or Internet.
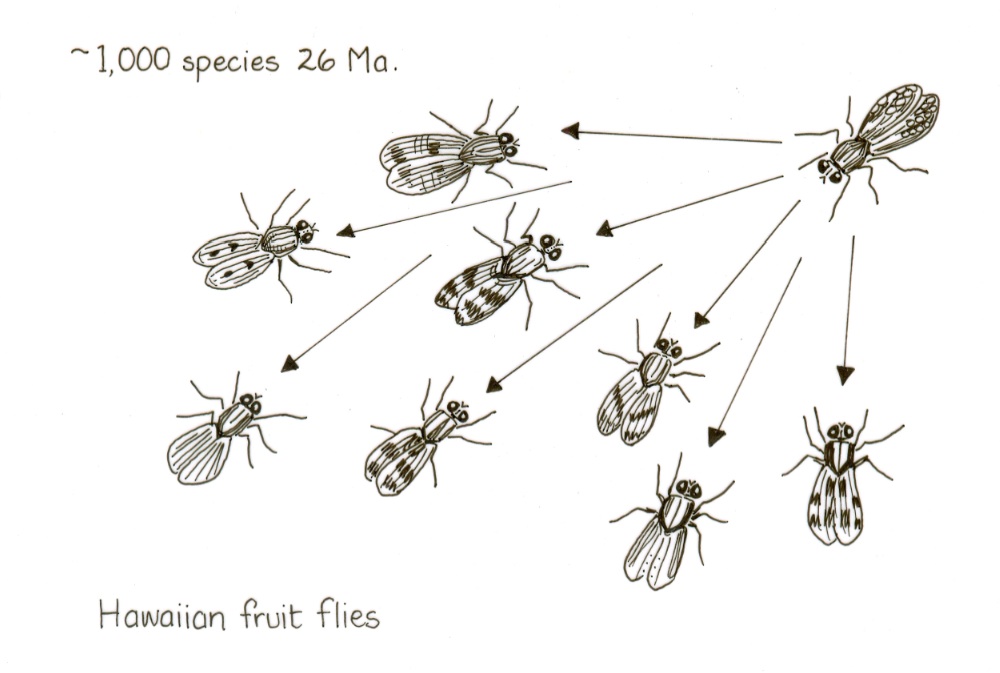
Note: If students’ item happens to be an example of adaptive radiation, have them research the original pioneer, note how many species evolved from the pioneer, and include a few images of the descendant species. For example, the introduction of a bellflower 15 million years ago resulted in 125 native Hawaiian species in the lobelia family.
4) Use register tape, flagging tape, or butcher paper to create a timeline from 30 MA (million years ago) to the present. The timeline should include at least three different scales: 30 MA – 5 MA, 5 MA – 0 AD, 0 AD – present. Extra credit: Have students create a logarithm to calculate the dimensions of the scales.
(To emphasize the magnitude of the 30 MA – 5 MA scale, tell students that if one inch represented 100 years, the timeline would stretch out 56 miles.)
5) Lead a discussion about plant and animal introductions to Hawaiʻi, based on Teacher Background “Rate of Introduction Script.” As each species or historic event comes up, have students stand and present their cards. If possible, project cards overhead while they are being presented. When finished, have students affix cards in the appropriate spot on the timeline. Introductions go above the timeline; extinctions go below. Ask students questions as you go along to stimulate critical thinking skills.
6) Have students complete the Student Pages “Rate of Introduction” (pp. 61-62 ) worksheet to determine the rate of introduction in different eras of Hawaiian history.
7) Use your timeline as the base for an x/y axis graphing the change: time along the x axis and introductions along the y axis. You can use string or flagging tape to indicate rate of change on the classroom timeline, or have students create one of their own on graph paper.
Journal Ideas
- What did you learn about the history of plant introductions in Hawaiʻi?
- How do you think we as humans can limit the rate of introductions to Hawaiʻi?
- At what point in the timeline did native species begin to be displaced? At what point were humans negatively impacted?
- Speculate a present outcome if different steps on the timeline were omitted. For example: what if mosquitoes hadn’t been introduced?
Assessment Tools
- Completed timeline cards
- Participation in class discussion
- “Rate of Introduction” worksheet
- Journal entries
Media Resources
- None

